
This story is a part of Hive Students’ Projects Showcase, where students share their talents, endeavours, experiences, and projects. In these student written articles Hivers present their work, the challenges they might have faced and the learnings they gathered.
Fractol - A school project with extra-curricular value
We’ve all been there. Working on our school projects trying to just get it done so we can move on to the next project. Nothing bad about that per se, because getting experience and moving forward is a sign of progress and the curriculum has been designed in such a way that with passing submits you’ll already hold enough knowledge that will help you with the next project and later at work. A great curriculum is one of the best values at Hive.
But sometimes there’s an assignment that just gets you so excited that a minimal submission just doesn’t cut it for you. What if your school project -- whose purpose normally is to teach you the required skills and eventually get you a job -- would have value outside your curriculum already early on in the school year?
I had just moved to my own apartment and wanted to do some kind of an art piece to put on my wall. And at the same time I was aching to do something more visual projects at school after the first 3D wireframe application on the graphics path. I set my eyes on ft_fractol. It’s an assignment on the graphics path at Hive where your job is to create an interactive 2D application in which you can explore Fractals - visually pleasing infinitely repeating mathematical algorithms that produce amazing pictures.
The assignment contains Mandelbrot and Julia set at minimum and more which you can come up with yourself. Most of the fractals are variations of those two. So basically once you have one down it’s quite easy to add others. You must be able to zoom infinitely into them (within floating point precision limitations) and move with your mouse.
Anybody can do this, and in fact a fractal application can be built in a few minutes. Below you can see an ascii mandelbrot which can be written in 5 minutes, though it can take a little while to understand the math.
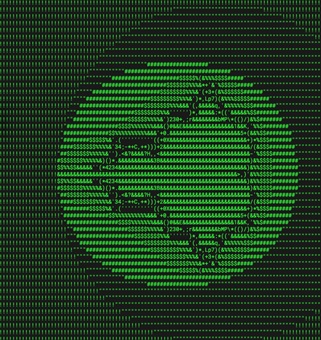
In short, the idea is that every pixel on screen (or in ascii grid any x, y point) is linearly scaled between -2.0 and 2.0 to be the starting value for the algorithm. The scale affects the “zoom” of the image. X represents real values and Y represents complex values. The iterative function calculates how many iterations it takes to conclude that the numbers’ result begins approaching infinity (does not belong to the set) or reaches max iterations (might belong to the set). The more max iterations, the more intricate the image will be (above you’ll see that with just 1 - 2 iterations the image is just a circle. You can look into the Wikipedia articles above if you’re interested in the math more.
If almost anyone can make something like this in a few minutes how can one produce something actually cool with this project. Something that you’d even like to look at on your wall and be proud of?
My art piece dream in mind I thought fractals are all about colors. So I knew I had to put an extra effort into how the colors can be adjusted & changed. So on top of making the fractal calculation performant and pass the requirements along with plenty of bonuses I needed Some way to generate a visually pleasing color palette for the application. It needed to be adjustable on the fly. Be able to create exact colors that match the colors I have in my living room where I wanted to put the art piece. Export an image that can then be printed in a print-shop on some fancy paper (I went for the Japanese kind!)
Your color palette determines what the fractals look like. There are various different visualization methods, but the most basic is as follows: The pixel color is selected with the remainder of the iteration and palette size. So with 15 iterations with a color palette of 11 colors, we would select a color at index 4.
palette[iter % palette_size]
This produces colors like below with clear lines when moving from color to the next.
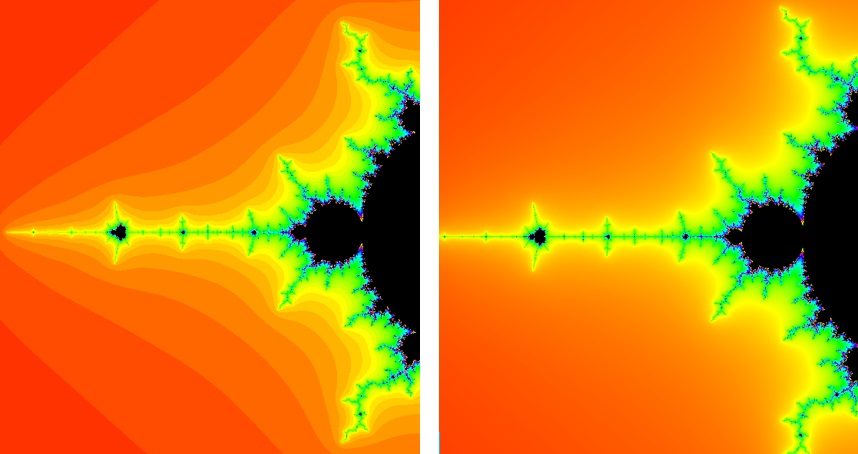
One really easy way to improve the visuals of your fractal is to smooth colors. Here’s one guide for how to do that. Basically you calculate a fraction with which you select a linearly interpolated color between two consecutive colors in the palette. Smooth colors shown above on the right.
I created a default palette of six colors. The program splits the palette into more colors, so e.g. below the default 6 is split into 50 colors. All this needed to be visualized in the UI like below.
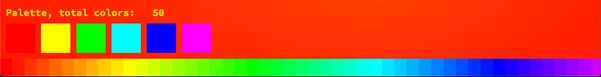
The palette size can be increased on the fly which produces a really cool psychedelic effect when zoomed in somewhere inside the app. The colors “move” further as the remainder of the iteration changes as palette size changes. The palette colors can also be randomized to explore colors that you would not even think of.
To properly input specific colors, I created a parser and an option to input colors to the fractal explorer up to 12 colors (which are then split to 50-n palette size). The colors can be inputted as red, green, blue values separated by | like so:
./fractol julia -colors=255,255,255\|25,25,112\|204,85,0
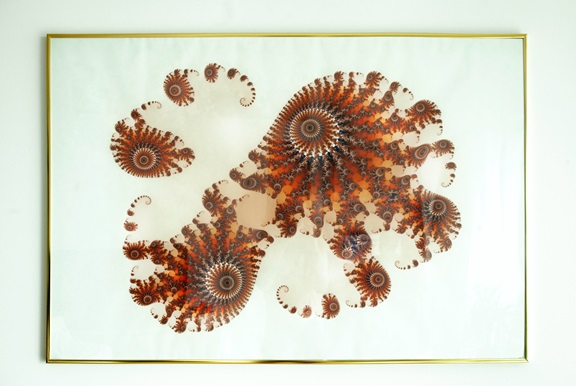
Here’s one of my favorites framed with above input example’s colors
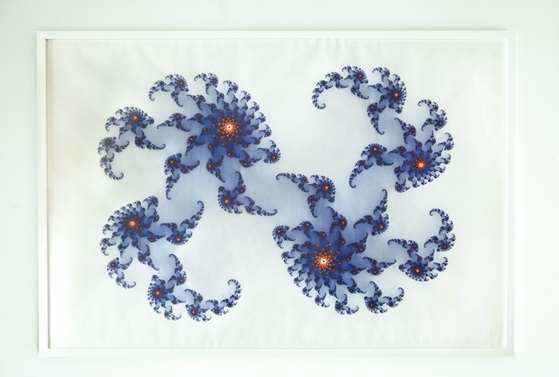
Lastly, I needed a possibility to generate a bmp image when pressing a button. My girlfriend who knows all about prints and photos reminded me that the resolution that the app runs at is not going to be enough for a proper print. I had not thought of this initially, just naively thought the regular resolution would be enough. Thus I needed to refactor and create some special functionality to generate a high resolution image. With such a high resolution the app would not be usable on regular screens nor would it perform when exploring the fractals. We only need the high resolution for the export and low resolution for the exploration. The refactor took some time, because the original design did not take this into account correctly. The higher resolution export with a large amount of max iterations can take more than a minute to generate because of the amount of calculations the app needs to do for each pixel. The resolution is probably the largest factor on graphics calculations. If you double the resolution, you square the number of pixels. A good print for the 100cm x 70cm required 16k * 16k resolution. That’s about 260 million pixels.
Finally, I was pretty happy with the code. It was time to do prints. Here’s the result with a-similar-to-phoenix-fractal version of the Julia set.
A minimum version of the assignment can be made in 2 days. With all of what I wanted my app to be able to do, and bugs I introduced along my feature creep, and time it took to fix them, it took about 4 weeks.
Moving on within the curriculum has its own value. Just passing versus adding that extra effort for something more impressive is always a tradeoff. “Done is better than perfect” and so on..., but sometimes it’s just nice to make something more satisfying even if it is just for yourself. Nothing is ever good enough though, but time to move onwards. I’m very happy with how the prints turned out and now decorate my living room.
You can see more examples, source code and a guide for this app at my github.